
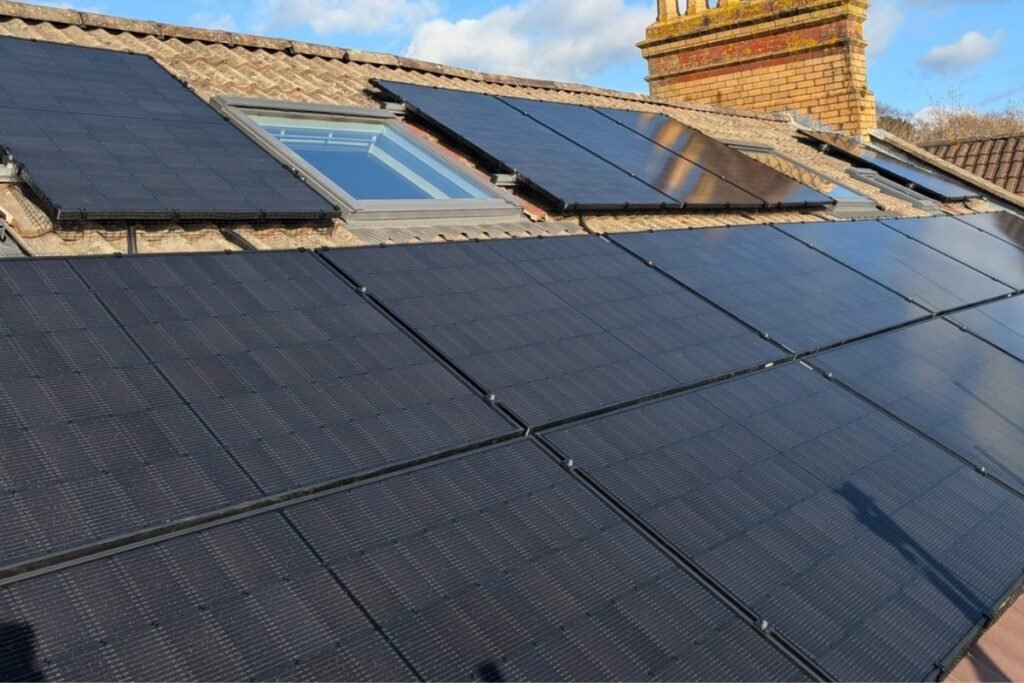
Yes, solar panels are worth it in the UK when they’re paired with battery storage and the right tariff. I can prove it without a single projection, because I’m about to show you twelve months of my own electric bills.
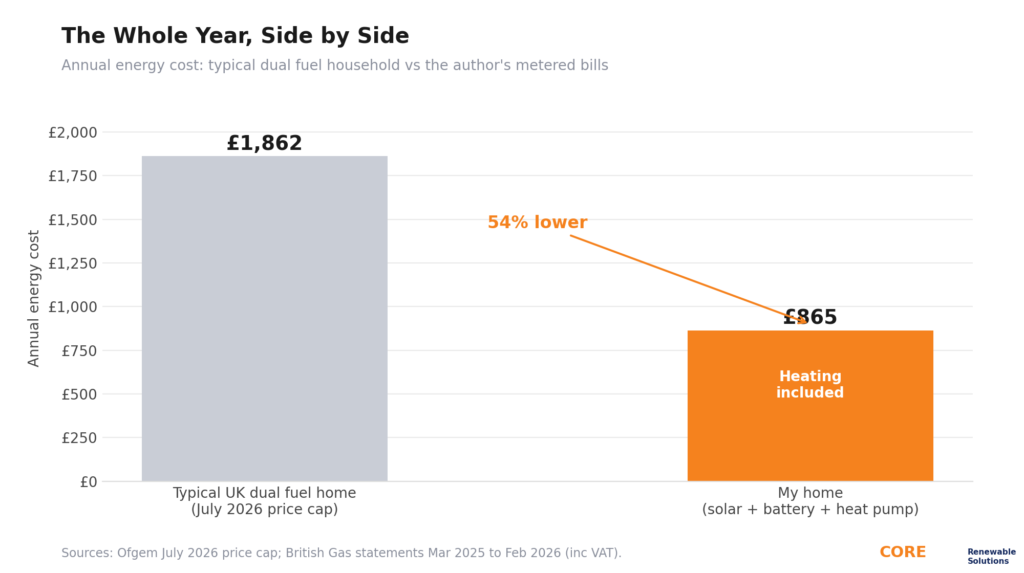
I install solar, battery storage and heat pumps for a living. My house in Warmley, Bristol runs entirely on electricity: an air source heat pump for heating and hot water, plus every appliance in the house. No gas supply at all. My total electricity cost for the year was roughly £865. The typical UK dual fuel household pays £1,862 a year under the current price cap, and that household still burns gas to stay warm.
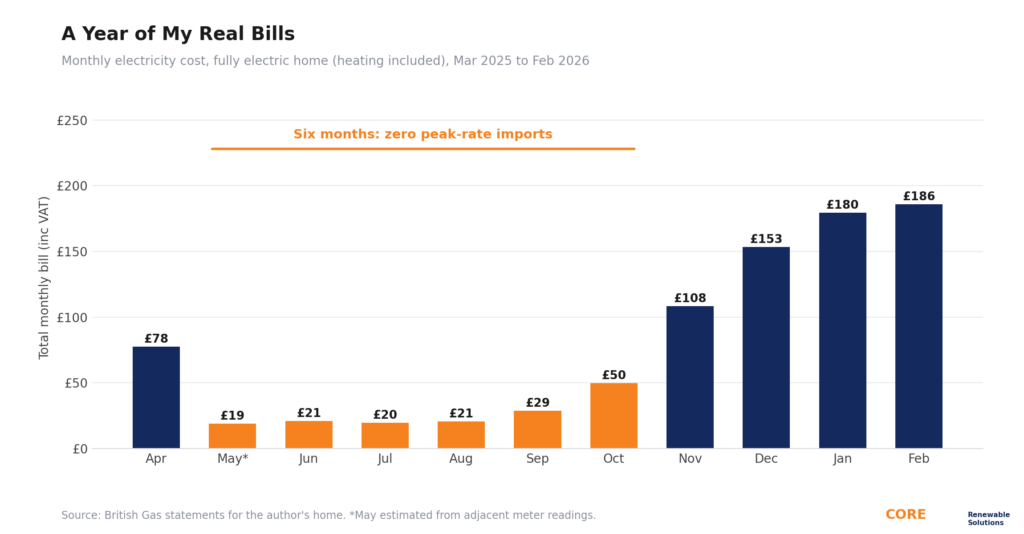
For six months of that year, my meter recorded zero peak-rate electricity. Not a small amount. None.
I’ll be straight about one thing before we start: this is my house. I fit these systems for other people every week, and I fitted my own home first. So I’m not going to hide anything behind “a customer of ours”. You’ll get the full system spec, the tariff, every monthly figure, and the complete methodology at the end of the page. If it’s worth doing to your house, it had to be worth doing to mine. Judge the numbers for yourself.
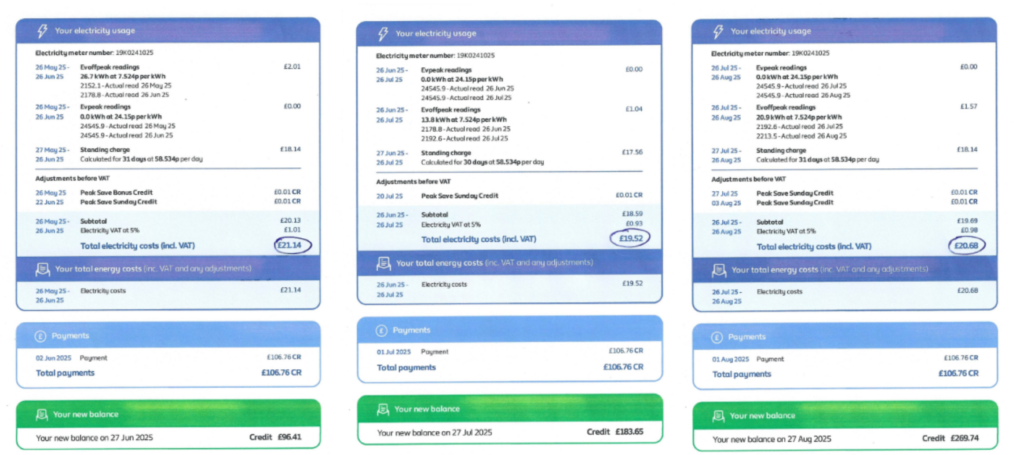
People don’t believe them until they see a real bill. So here they are, in black and white from British Gas, every month for a year.
The Typical UK Energy Bill Keeps Climbing
The context for every solar decision in Britain is the price cap.
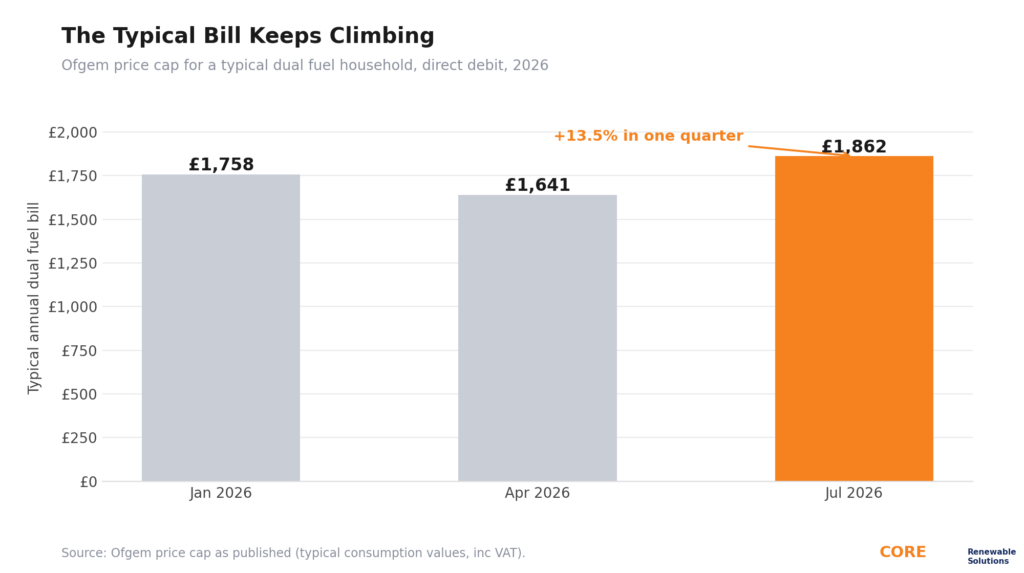
Ofgem’s cap for a typical dual fuel household rose to £1,758 in January 2026, eased to £1,641 in April, then jumped 13.5% to £1,862 on 1 July 2026. Under the July cap, the average electricity unit rate is 26.11p per kWh with a 57.19p daily standing charge, and gas is 7.33p per kWh with a 29.04p daily standing charge. The two standing charges alone cost a typical home around £315 a year before a single unit is used.
Every one of those numbers is outside your control. You don’t set the unit rate, the standing charge or the next quarterly change. The only lever you truly own is how much of that priced electricity you need to buy.
That’s the lever this page measures.
My House and My System
- Location: Warmley, Bristol
- Energy setup: fully electric, no gas supply
- Heating and hot water: air source heat pump
- Generation: 14 kW solar PV array
- Storage: 11 kWh battery storage
- Installed: September 2023, by us at Core Renewable Solutions
- Tariff: British Gas Electric Driver, a time-of-use tariff with an off-peak rate of 7.524p per kWh and a peak rate of 24.15p per kWh
Note what this house doesn’t have: a gas boiler, a gas bill, or a gas standing charge. The heating runs on the same electricity supply as the kettle. So the statements below are the entire cost of powering and heating my home. There is no second bill hiding behind them.
What My Meter Did Across Twelve Months
Eleven consecutive British Gas statements cover 27 March 2025 to 26 February 2026, with one 27-day gap in May. All totals include VAT at 5%.
| Statement period | Peak kWh | Off-peak kWh | Total bill |
| 27 Mar – 29 Apr 25 | 28.2* | 73.3* | £77.58 |
| 30 Apr – 25 May 25 | (estimated) | (estimated) | ~£19 |
| 26 May – 26 Jun 25 | 0.0 | 26.7 | £21.14 |
| 26 Jun – 26 Jul 25 | 0.0 | 13.8 | £19.52 |
| 26 Jul – 26 Aug 25 | 0.0 | 20.9 | £20.68 |
| 26 Aug – 26 Sep 25 | 0.0 | 126.0 | £28.90 |
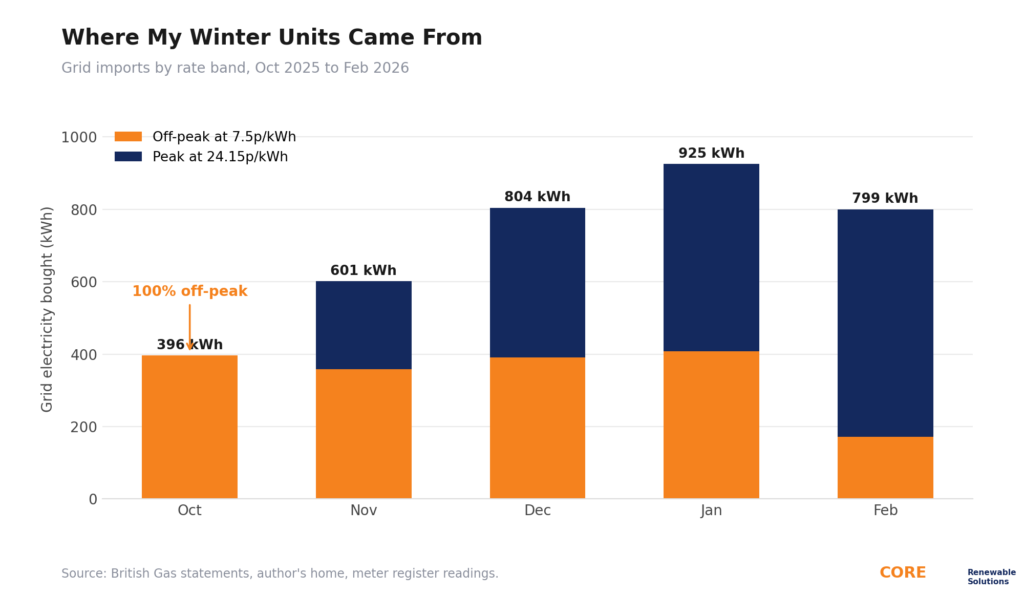
| 26 Sep – 26 Oct 25 | 0.0 | 396.2 | £49.69 |
| 26 Oct – 26 Nov 25 | 242.8 | 358.4 | £108.50 |
| 26 Nov – 26 Dec 25 | 412.2 | 391.6 | £153.41 |
| 26 Dec 25 – 26 Jan 26 | 517.8 | 407.4 | £179.56 |
| 26 Jan – 26 Feb 26 | 627.3 | 172.1 | £186.00 |
| Year | ~1,828 | ~1,986 | ~£865 |
*The March to April statement spans a tariff change; the split shown covers the time-of-use portion.
Three things stand out.
My peak register froze for half the year. It read 24545.9 on 29 April 2025 and still read 24545.9 on 26 October 2025. For six months, the house bought no daytime-rate electricity whatsoever. The solar covered the day, the batteries covered the evening, and a small off-peak top-up covered the rest.
Summer bills were, in effect, the standing charge. June’s £19.52 breaks down as £18.44 of standing charge and £1.04 of electricity. My house ran on bought energy costing about 3p a day. The solar covers the house during the day and fills the batteries, and the batteries run the house in the evening. The meter barely moves.
Even my worst month beat the average. The most expensive statement of the year, £186.00 in deep winter, covered the heating, the hot water and every appliance. Ofgem’s typical dual fuel household averages £155 a month across the year, and that home still heats with gas. My twelve-month average was £72 a month.
Do Solar Panels Work in Winter? Here’s What My House Did
The most common objection I hear on surveys is winter. Shorter days, weaker sun, higher heating demand. Fair. So here’s exactly how my house handled it.
The system stacks two winter strategies on top of whatever the panels still generate.
First, the batteries charge at 7.5p and discharge at peak time. On my tariff, the early-morning off-peak rate is 7.524p per kWh against a daytime rate of 24.15p, and against a price-capped average of 26.11p that most households pay all day. The cheap winter bills are the effect of the solar plus charging the batteries at a cheap rate in the early morning and using that power through the day. Even on a grey December day, I’m running the house, and heating it, partly on electricity I bought for less than a third of the normal price.
You can see the strategy directly in my meter registers. In October, all 396 units the house bought were off-peak. In November and December, the split was roughly half and half.
Second, the heat pump multiplies every unit. A well-installed air source heat pump delivers around 3 to 4 units of heat for every unit of electricity it consumes. A unit bought at 7.5p and turned into three units of heat is, in effect, heat at 2.5p per kWh. Mains gas under the July 2026 cap costs 7.33p per kWh before boiler losses.
So do solar panels work in winter? The panels generate less, yes. The system still works, because the battery and the tariff carry the load the sun can’t.
The Maths Against a Typical UK Home
| Typical UK dual fuel home (July 2026 price cap) | My home (metered, Mar 2025 to Feb 2026) | |
| Heating | Gas boiler | Air source heat pump (electric) |
| Annual energy cost | £1,862 | ~£865 |
| Energy bought | ~14,200 kWh (2,700 kWh electricity + 11,500 kWh gas) | ~4,000 kWh |
| Standing charges | ~£315 (two fuels) | ~£226 (one fuel) |
| Cheapest month | Summer bills fall, but gas and both standing charges continue | £19.52 |
| Most expensive month | Deep winter | £186.00, heating included |
On the metered year, my home ran at roughly 54% below the typical dual fuel bill while heating itself entirely with electricity, something the typical bill doesn’t even attempt. It bought around 4,000 kWh for the year against the roughly 14,200 kWh of combined energy a typical home purchases.
And the gap compounds. Every future price cap rise lands on the units a household has to buy. I’ve cut those units by more than two thirds and buy over half the remainder at 7.5p.
Now, the obvious objection, and I’ll make it for you: I’m the installer. Of course my system is set up well. That’s precisely the point. This page shows you what the technology does when it’s specified and installed properly, with the full spec disclosed so you can judge how your home compares. Your roof, insulation and usage will differ, which is why every job we do starts with a survey rather than a promise.
What Actually Makes Solar Worth It (What to Look For)
Whether you buy from us or anyone else, my year of bills points to five things that separate a system that transforms your bills from one that mildly reduces them:
- Battery storage sized to your evening use. Panels alone typically let you use 30 to 50% of what you generate. With a battery, that rises to over 80%, and it’s the battery that produced my six months of zero peak imports. Around 94% of new residential solar installations now include one.
- A time-of-use tariff to pair with it. My winter strategy only works because the batteries can buy at 7.5p. Ask any installer how the system design supports off-peak charging, not just solar self-consumption.
- MCS certification, non-negotiable. Without an MCS-certified installation you cannot receive Smart Export Guarantee payments for the energy you export. We’re MCS certified, number NAP-77210.
- A system designed around your usage, not a standard kit. My results come from matching array size, battery capacity and heat pump output to how my household actually uses energy. A free site survey that measures your usage is the minimum.
- 0% VAT while it lasts. New residential solar installations are VAT-free until 31 March 2027, a 20% saving that has a hard deadline.
A Year of Bills Is the Only Brochure That Matters
For years, solar in the UK has been sold on projections: modelled savings, estimated payback, assumed generation. Projections are fine. Bills are better.
I wouldn’t sell a system I wouldn’t put on my own roof, so I put it on my own roof first, and now the bills are public: a fully electric house, heating included, running for about £865 a year, with six months of zero peak-rate imports and summer bills that were little more than the standing charge.
We design and install integrated solar, battery storage, air source heat pump and EV charging systems across Bristol and the South West. Every installation is MCS certified, starts with a free site survey, and is sized around your roof, your usage and your bills.
Look at a real bill, not a brochure. Mine came to under £900 for the whole year, heating included.
Frequently Asked Questions
Are solar panels worth it in the UK?
Yes, particularly when paired with battery storage. The real bills on this page show my fully electric Bristol home (solar, battery and air source heat pump) spending roughly £865 on electricity across twelve months, including all heating, against a typical dual fuel bill of £1,862 under the July 2026 price cap. Results vary with system size, property and usage, which is why a site survey comes first.
Do solar panels work in winter in the UK?
Solar panels generate less in winter but keep working in daylight. The bigger winter lever is battery storage on a time-of-use tariff: I charge my batteries at 7.5p per kWh overnight and run the house from them during the day. In October, every unit my house bought was off-peak.
Is battery storage worth adding to solar panels?
On this evidence, the battery is what turns solar from a discount into a transformation. Panels alone typically lift self-use to 30 to 50% of generation; with a battery that rises to over 80%. My six months of zero peak-rate imports are a battery result as much as a solar one.
Can you run a whole house on solar and batteries in the UK?
In summer, close to it. My house bought £1.04 to £2.01 of electricity per month from May to August, with the rest of the bill being the fixed standing charge. Across the whole year it still bought around 4,000 kWh, mostly off-peak in winter, so the grid connection remains essential; the point is how little of the grid’s daytime-priced electricity it needed.
Does a heat pump make electric bills expensive?
Not in my house. The heat pump multiplies each unit of electricity into roughly 3 to 4 units of heat, and my heating ran largely on off-peak and stored power. My most expensive winter month was £186.00 with all heating included; a typical dual fuel home averages £155 a month and heats with gas on top of its electricity use.
Methodology and Sources
I want every number on this page to be checkable, so here is exactly where the data comes from and how it was handled.
Disclosure. The property in this study is my own home. I own Core Renewable Solutions and I installed the system. I’m publishing my bills first because they’re the ones I have a complete record and full consent for; customer bill studies, published on the same terms, will follow. The full system specification is stated above so readers can judge how their own property compares.
Household bill data (Charts 2 and 3, monthly table). Figures come from fourteen British Gas statements for my home in Warmley, Bristol, of which eleven form a continuous run from 27 March 2025 to 26 February 2026. Statement continuity was verified by matching closing and opening readings on the property’s meter across consecutive statements. Totals include VAT at 5%; statements printed before VAT have had it added. One 27-day gap (30 April to 25 May 2025) is estimated at ~£19 using adjacent daily rates; the meter readings bounding the gap show 41.9 kWh of off-peak and zero peak consumption, consistent with that estimate. Excluded as non-energy items: a £271.95 account adjustment (December 2024) and a £47.62 exit fee (March 2025). Redacted copies of the statements are shown on this page.
Price cap data (Chart 1, comparison table). Ofgem price cap figures for a typical dual fuel direct debit household: £1,758 (January 2026), £1,641 (April 2026) and £1,862 (July 2026), with July unit rates of 26.11p/kWh electricity (57.19p/day standing) and 7.33p/kWh gas (29.04p/day standing), per Ofgem as published by Uswitch, EnergyPlus and Utility Matchmaker. Combined typical standing charges of ~£315/year per MoneySavingExpert. Typical consumption values: 2,700 kWh electricity and 11,500 kWh gas.
Heat pump and battery figures. Heat pump efficiency (around 3 to 4 units of heat per unit of electricity) and annual consumption ranges per industry analyses by Eco Happy and Aira. Self-consumption uplift (30 to 50% without battery, over 80% with) and the 94% battery attachment rate for new installations are industry figures as used across our site.
The winter 2025 to 2026 pattern. The December to February statements show a higher share of peak-rate purchasing than the spring 2025 statements. [NOTE: Lee to add one-line explanation, e.g. charging routine, cold spell, EV, before publication.] Annual totals are reported as billed.
Sources
- Ofgem price cap, 1 July to 30 September 2026, via Uswitch (uswitch.com/gas-electricity/guides/price-cap/), EnergyPlus (energyplus.co.uk/news/ofgem-energy-price-cap-rates-by-region-july-2026) and Utility Matchmaker (utilitymatchmaker.co.uk/tools/price-cap-history)
- MoneySavingExpert, What is the Energy Price Cap? (moneysavingexpert.com/utilities/what-is-the-energy-price-cap/)
- Eco Happy, How Much Electricity Does An Air Source Heat Pump Use? (ecohappy.co.uk)
- Aira, Do heat pumps consume a lot of power? (airahome.com)
- British Gas statements for the author’s home, November 2024 to February 2026, redacted